
Advanced Analytics & Intelligence
Add-on moduleThe numbers your board asks for, computed from your own data.
Real-time TRIR, LTIR, DART and severity rates, statistical process control on the trends behind them, and a monthly read of what actually changed — all computed from your own records rather than a separate reporting tool.
Why it matters
Rates that reconcile
Incident rates are computed from the man-hours you logged, so the number on the dashboard is the number you can defend.
Signal separated from noise
SPC charts distinguish a genuine shift in performance from ordinary month-to-month variation.
Change you can see without building a report
Safety Insights summarises what moved in the last 30 days and what needs attention now, computed from your incidents, risks, CAPAs and objectives.
What you get
3 screens in the product — every image below is the real application.
Advanced Analytics & Intelligence
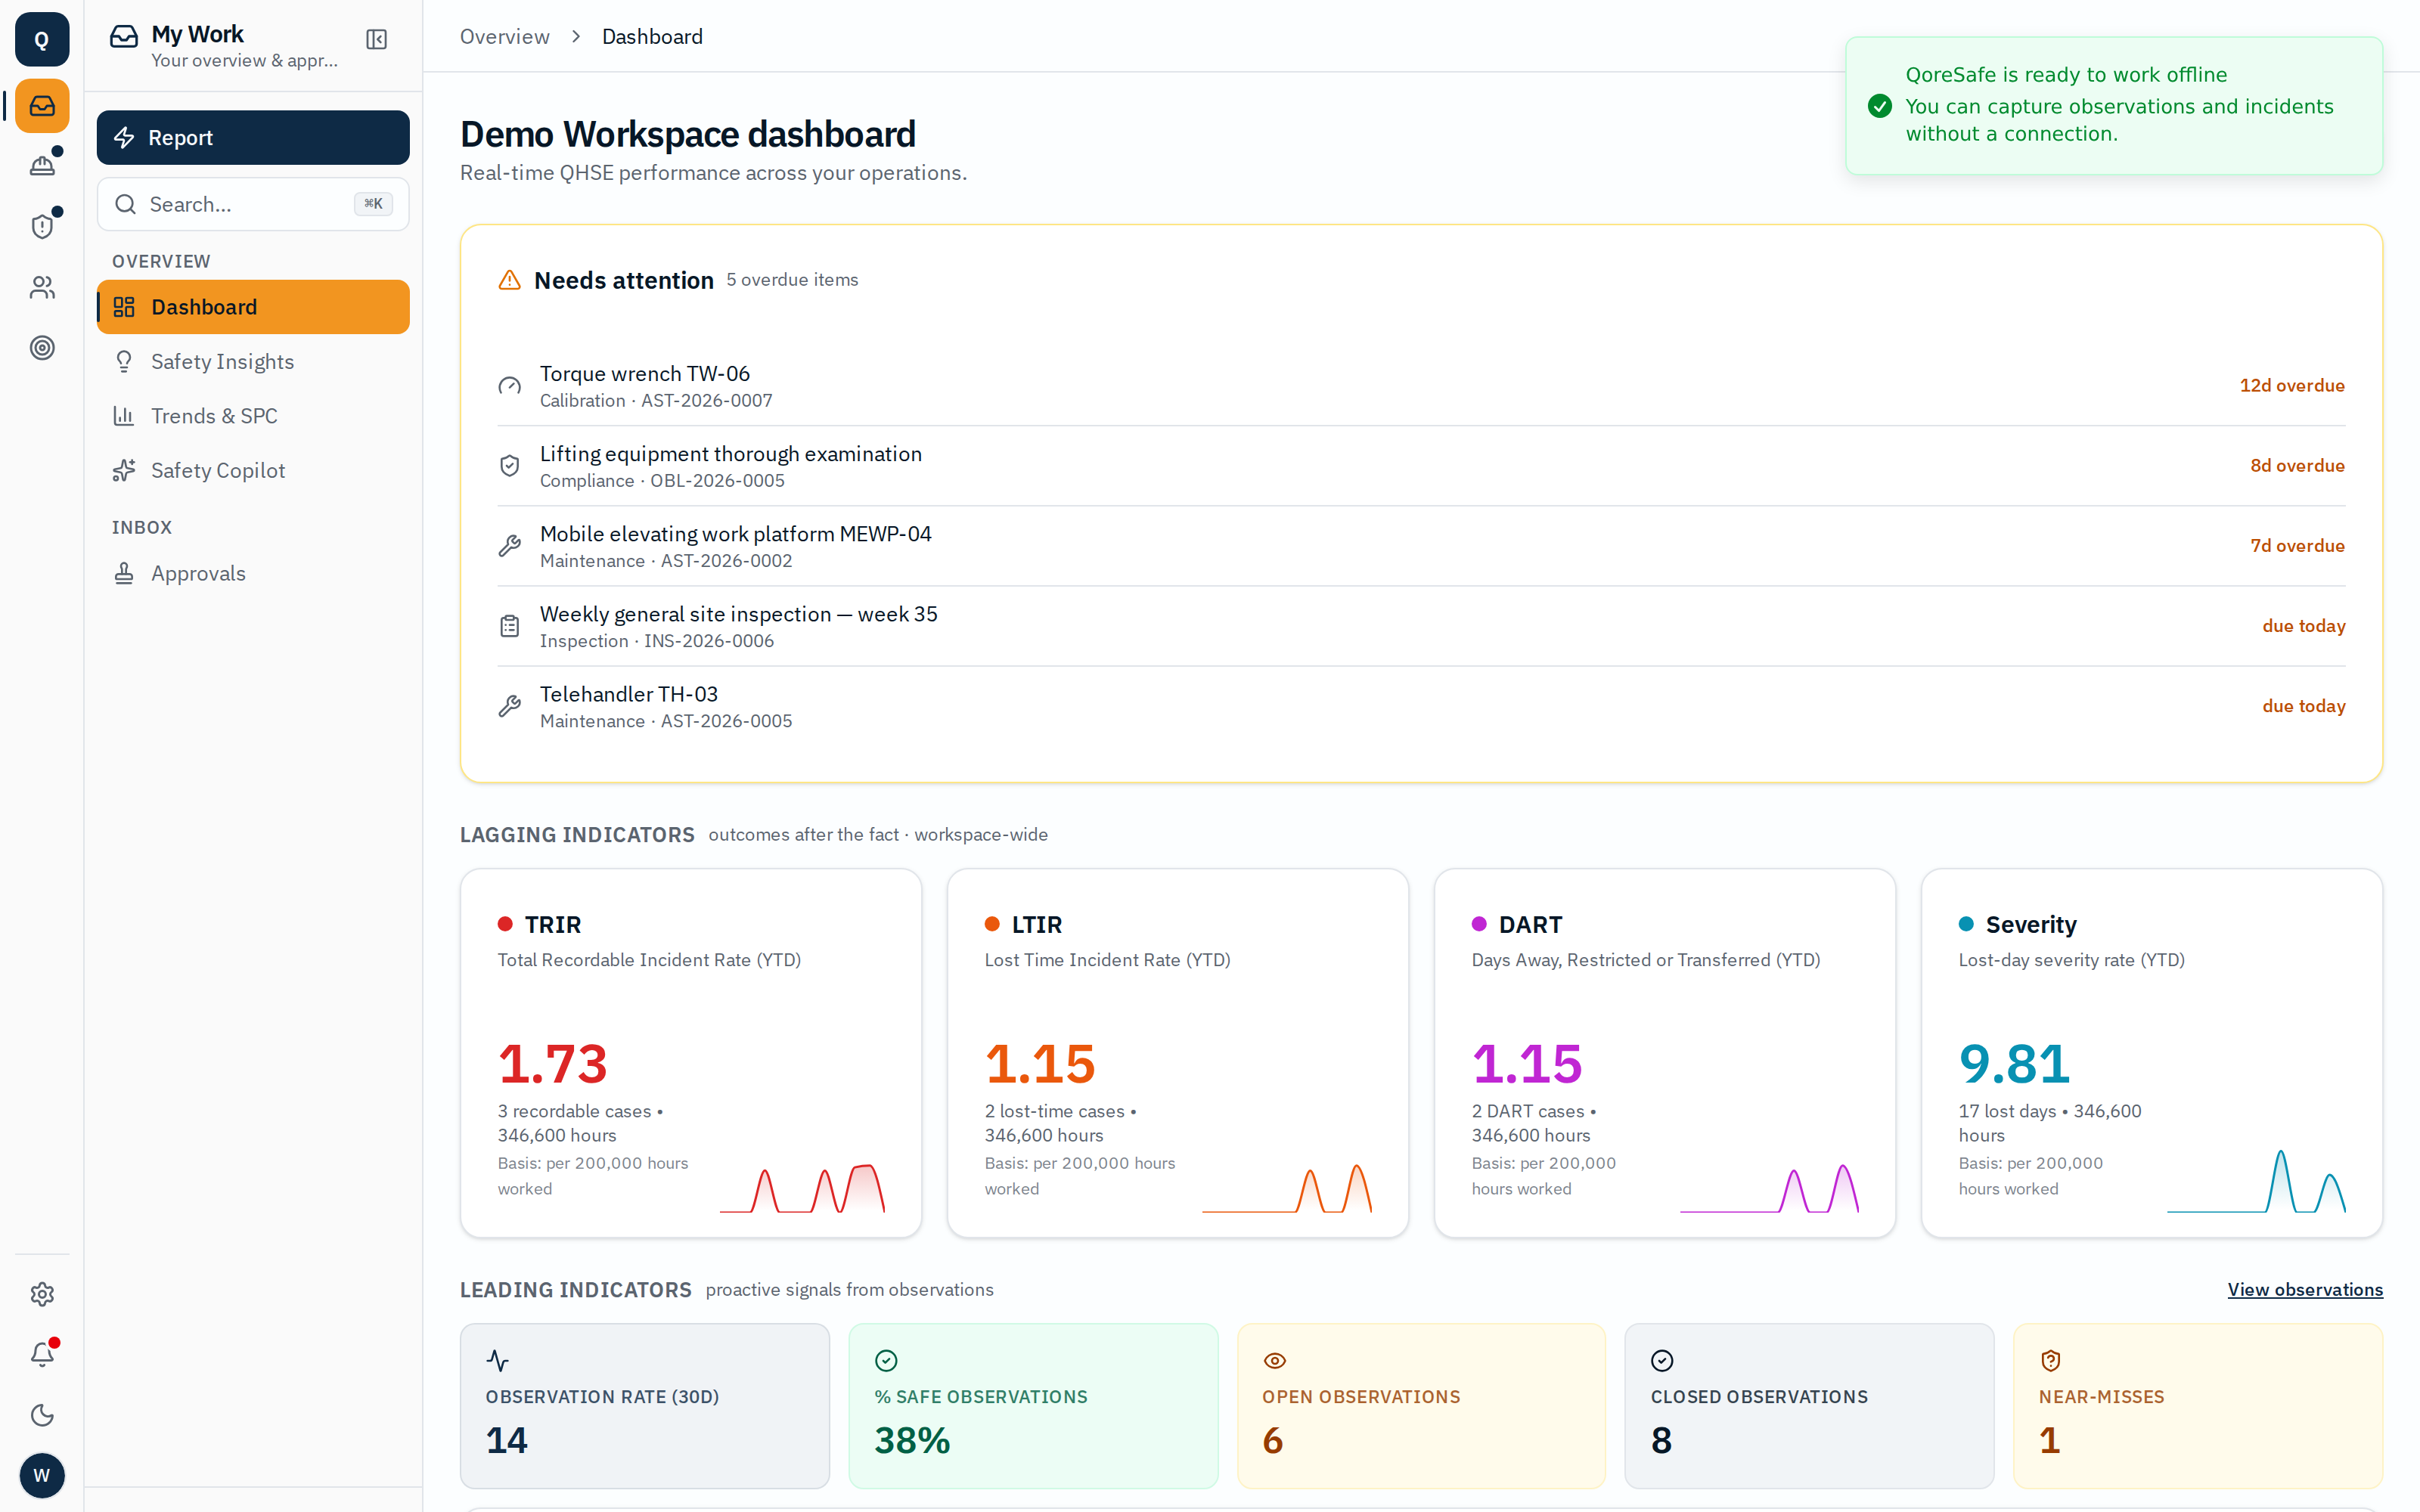
Real-time dashboard
Lagging indicators (TRIR, LTIR, DART, severity) alongside leading indicators, plus what needs attention right now.
Advanced Analytics & Intelligence
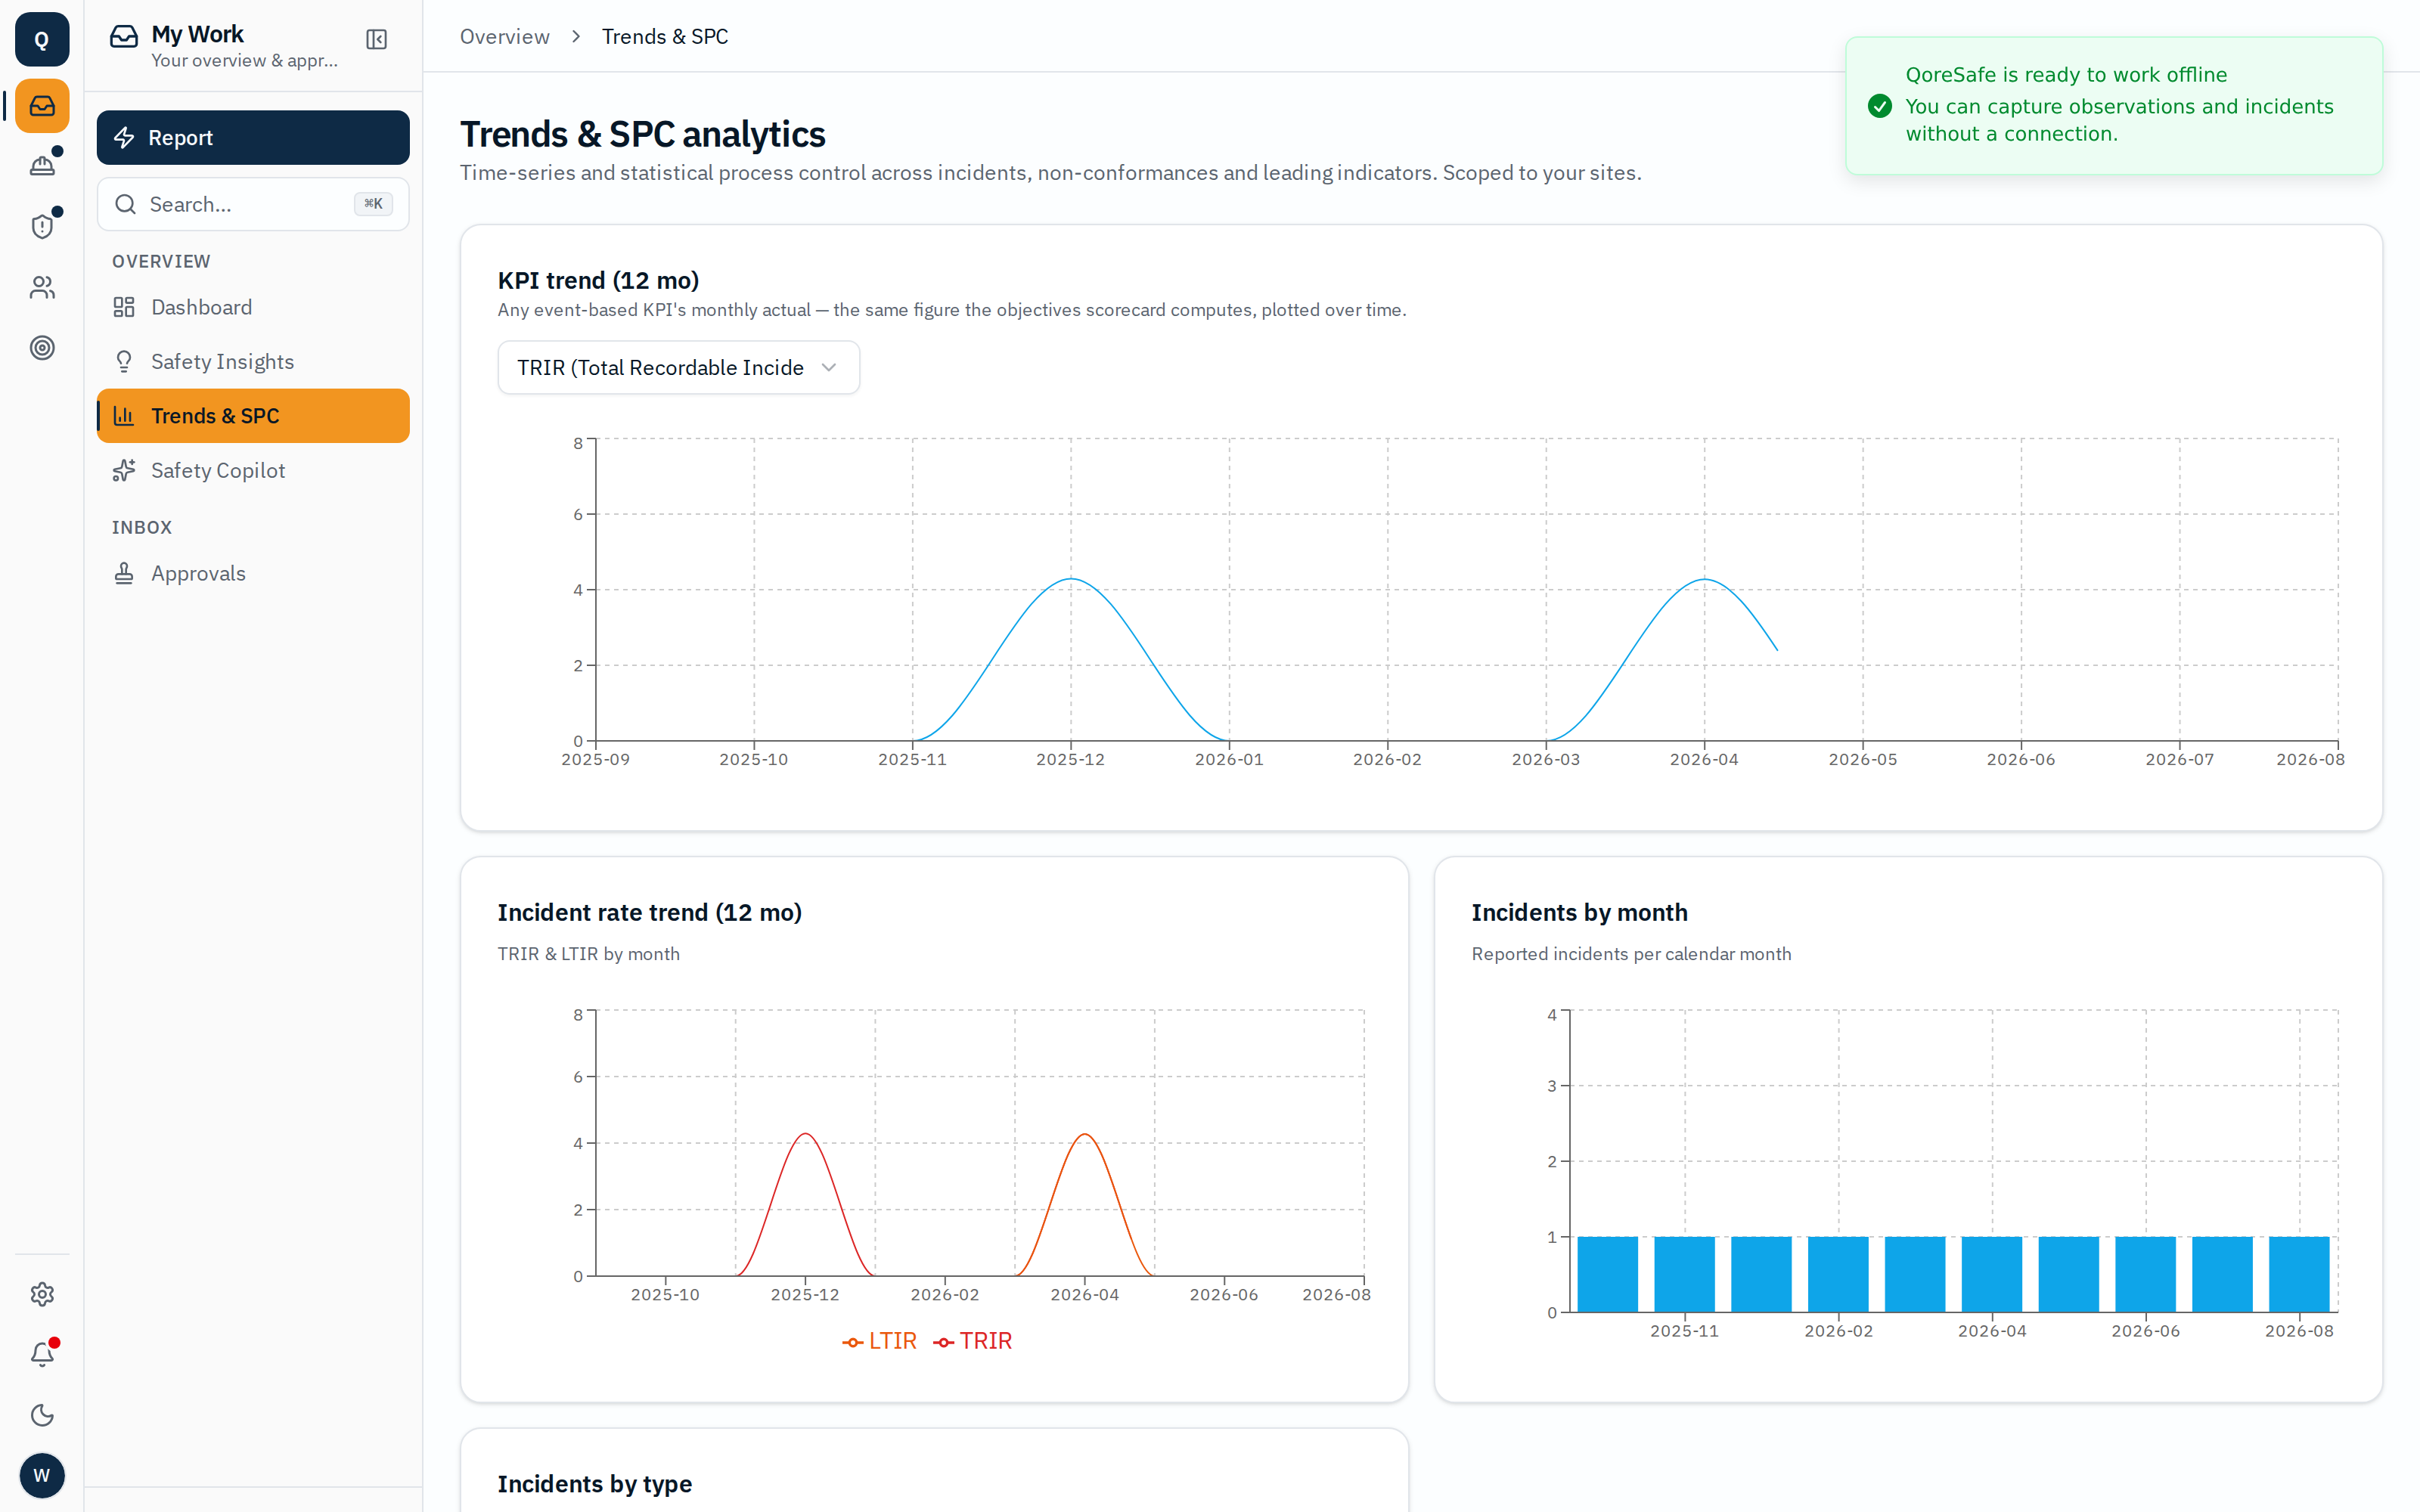
Trends & SPC analytics
Time-series and statistical process control charts across the QHSE metrics you track.
Advanced Analytics & Intelligence
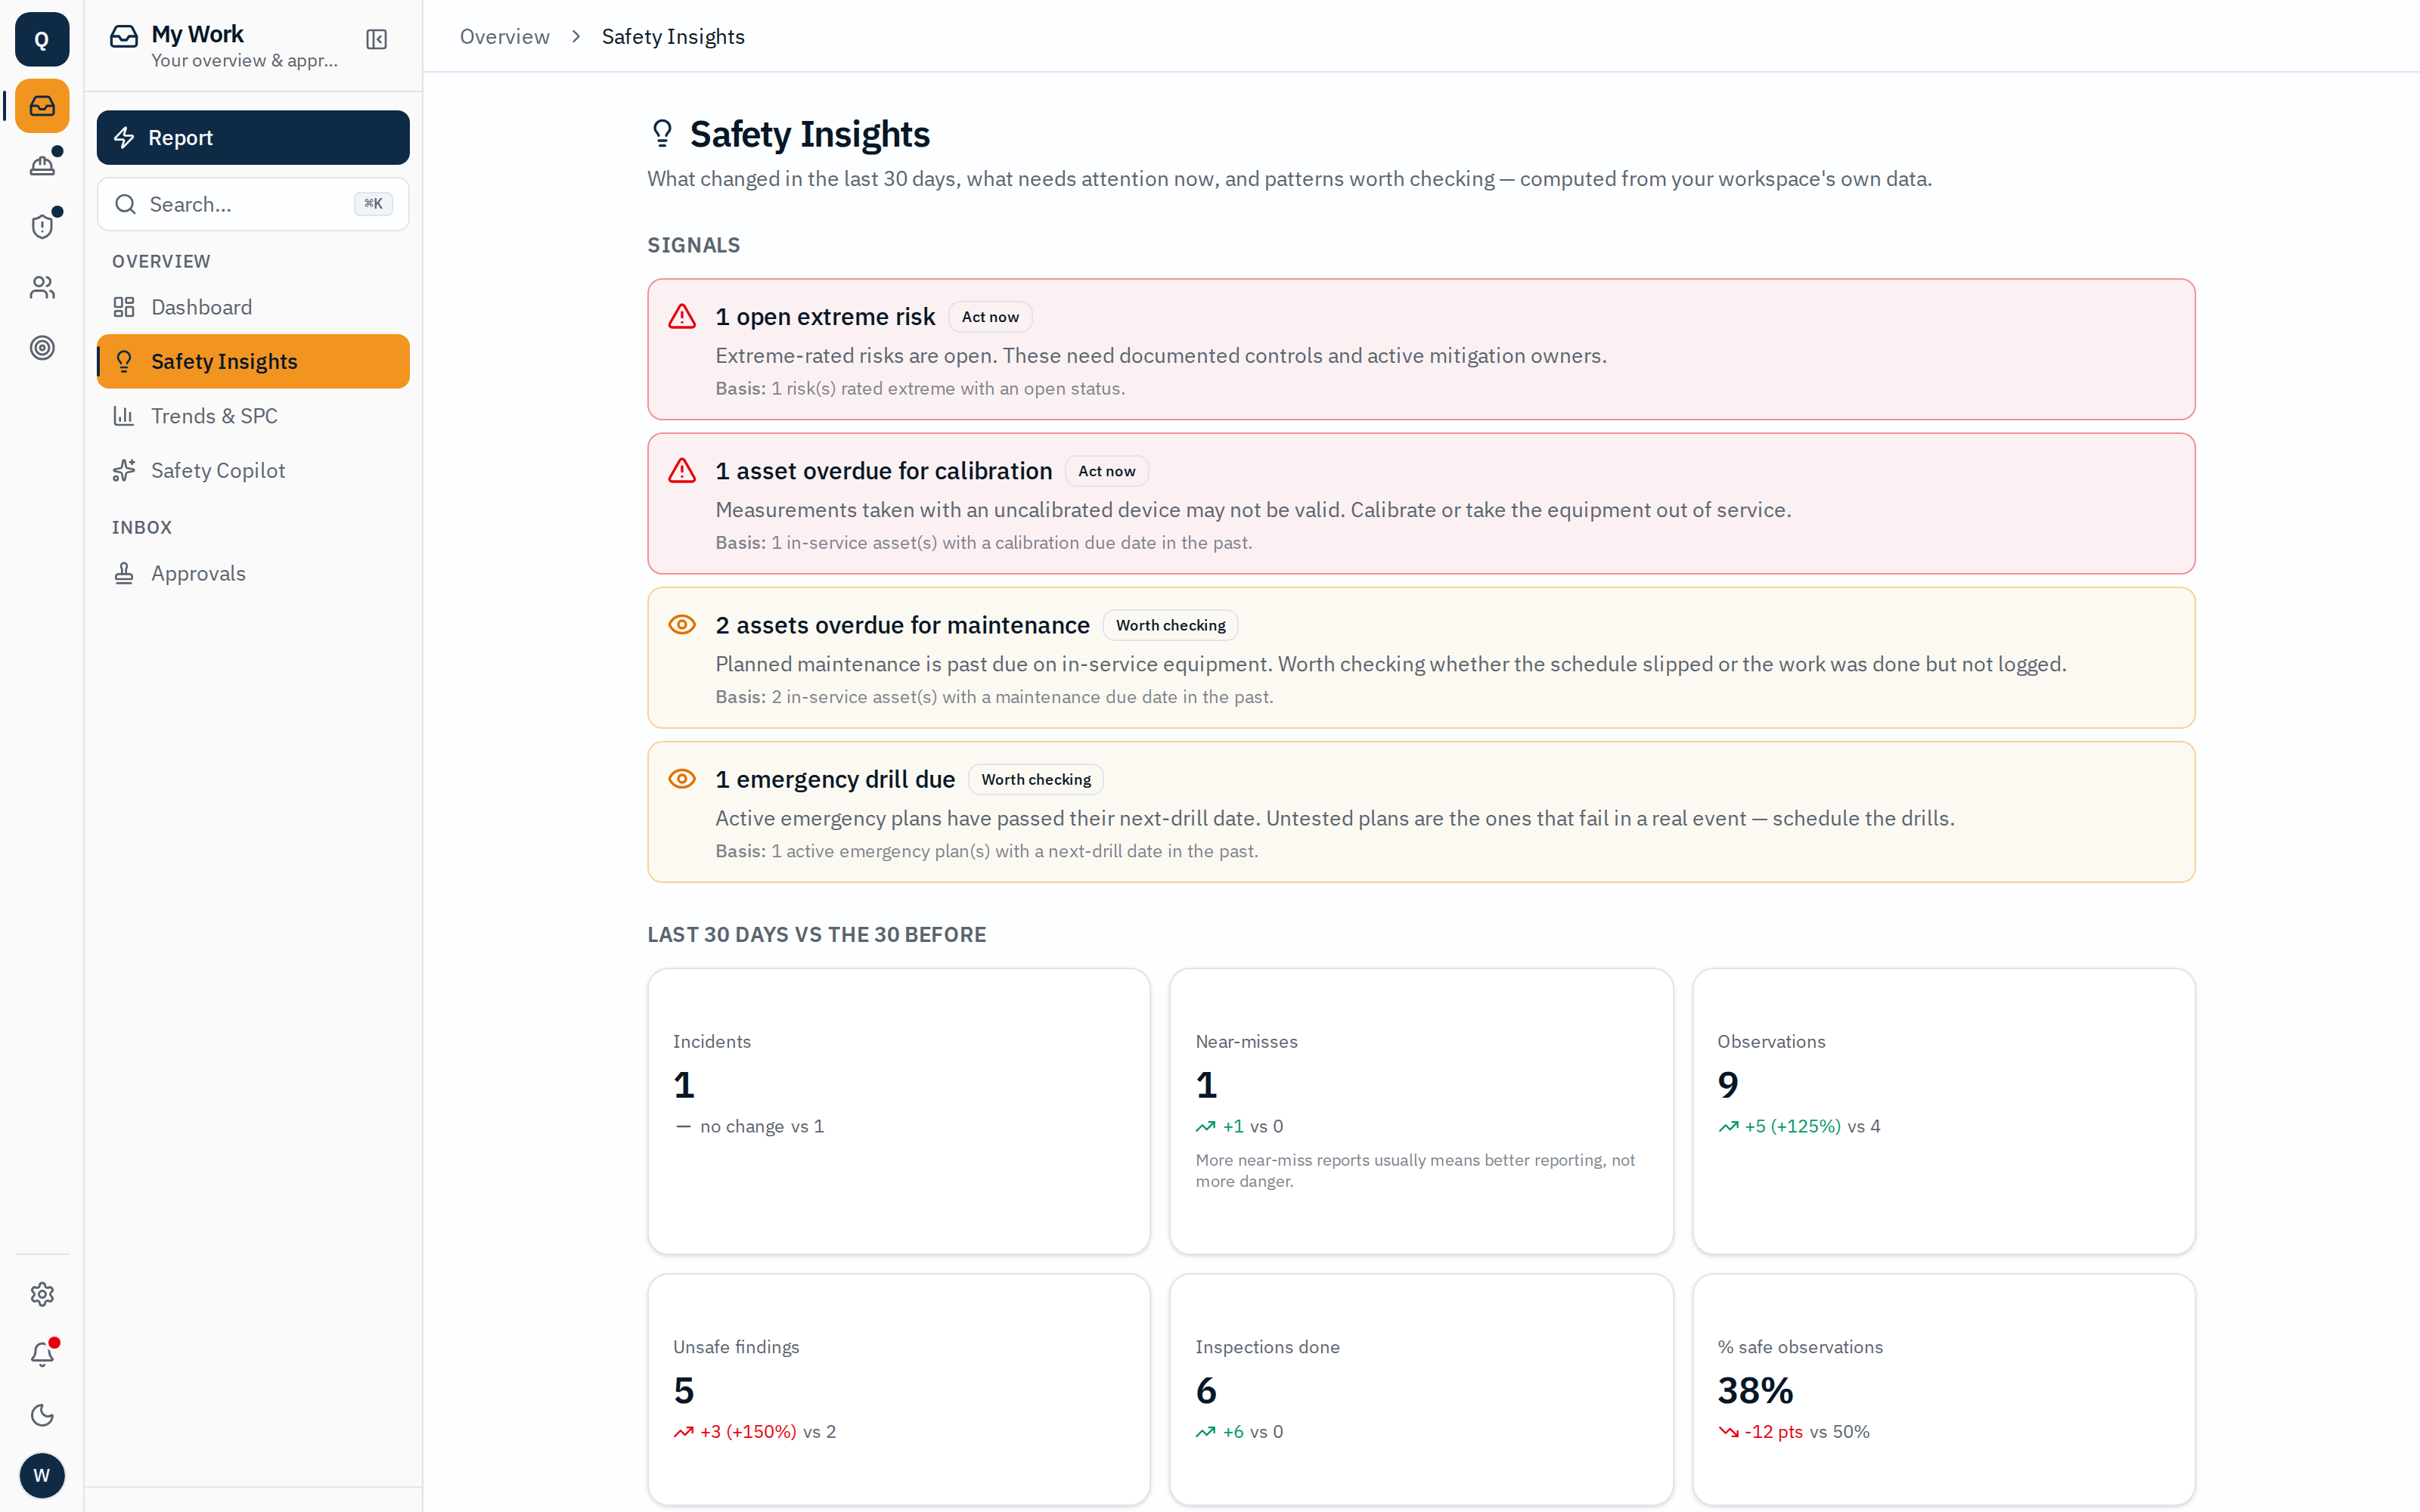
Safety Insights
What changed in the last 30 days, what needs attention now, and patterns worth checking — computed from your own data.
See Advanced Analytics & Intelligence on your own processes
Book a 30-minute walkthrough and we will map it to your standards, your sites and your team structure.